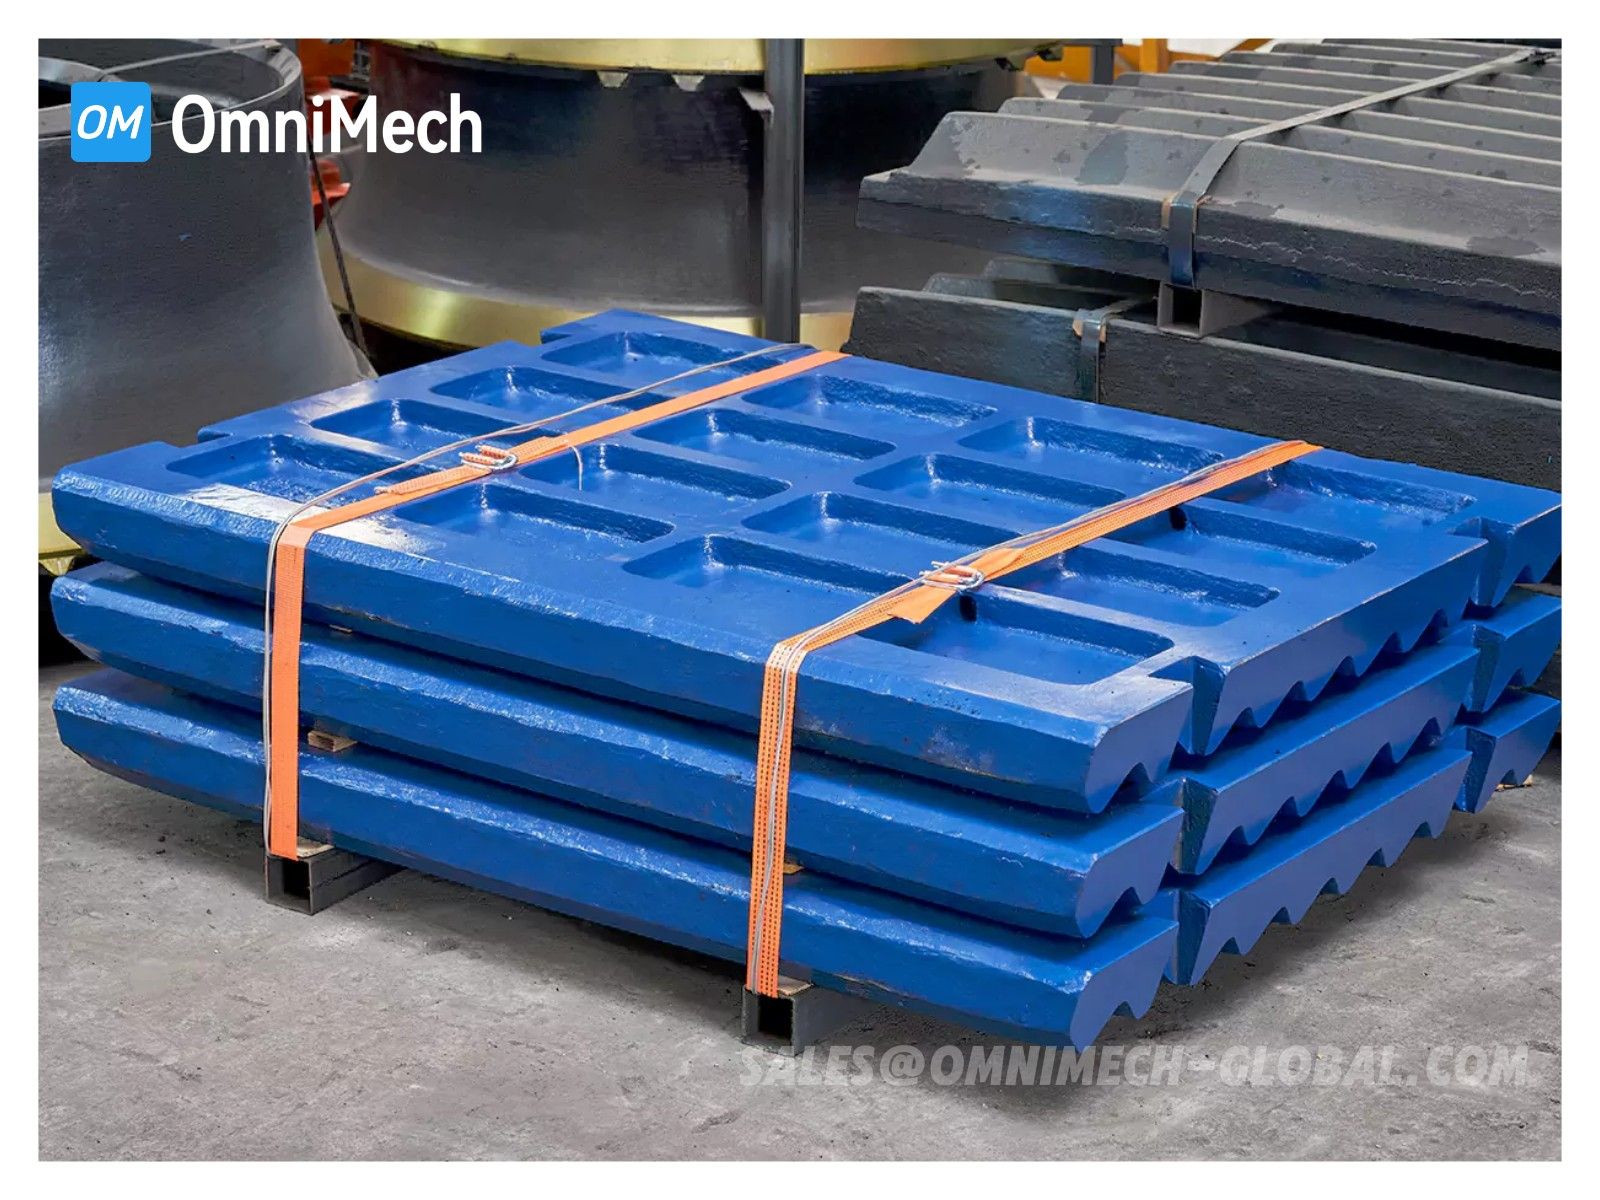
Crusher Maintenance Scheduling & Wear Parts Budget Planning
Why planned maintenance beats reactive maintenance
An unscheduled crusher shutdown costs 3–10× more than a planned one:
| Cost factor | Planned shutdown | Unplanned breakdown |
|---|---|---|
| Production loss | 0 (scheduled around) | Full rate × hours down |
| Labour | Scheduled crew, standard rates | Emergency call-out, overtime rates |
| Parts | Ordered in advance, best price | Emergency order, premium + freight |
| Secondary damage | Minimal (controlled shutdown) | Often extensive (running to failure) |
| Safety | Controlled environment | Higher risk (rushed, stressed crew) |
For a primary crusher producing 2,000 tph at $5/tonne margin: 1 hour of unplanned downtime = $10,000 lost profit. A 12-hour unplanned reline costs $120,000 in production alone — before parts and labour.
This guide shows you how to build a maintenance schedule and wear parts budget that minimises total cost.

Wear rate fundamentals
How to measure wear rate
For any liner, wear rate = (initial thickness − current thickness) ÷ operating hours
Example: Jaw plate installed at 80 mm, measured at 52 mm after 1,200 hours:
- Wear rate = (80 − 52) ÷ 1,200 = 0.023 mm/hour
- Remaining life at 50% limit (40 mm): (52 − 40) ÷ 0.023 = 522 hours
- Schedule replacement at ~450 hours (safety margin)
Factors that affect wear rate
| Factor | Effect on wear rate | Tracking method |
|---|---|---|
| Feed hardness | Harder ore = faster wear | Blast pattern, ore body model |
| Feed abrasivity (silica %) | Higher silica = faster wear | Geology reports, lab testing |
| Feed size distribution | Coarser feed = higher impact wear | Screen analysis, crusher CSS |
| Throughput rate | Higher tph = faster wear (but lower per tonne) | Crusher production logs |
| CSS (closed-side setting) | Tighter CSS = higher pressure = faster wear | Crusher setting logs |
| Material grade | Better grade = slower wear | Part records, benchmarking |
The wear curve is not linear
Most crusher liners follow a decelerating wear curve — wear is fastest when the liner is new (sharp profile, high contact stress) and slows as the profile flattens and contact area increases.
Thickness
80 mm ─────╲
            ╲
60 mm ───────╲───
              ╲
40 mm ─────────╲───────
                ╲
20 mm ───────────╲────────────
                  ╲
0 200 400 600 800 1000 1200 HoursImplication: Linear extrapolation from early measurements overestimates remaining life. Take measurements at multiple points to fit the actual curve.
Maintenance scheduling approaches
Approach 1: Calendar-based (simple but wasteful)
| Component | Interval | Pros | Cons |
|---|---|---|---|
| Jaw plates | Every 3 months | Simple scheduling | May replace too early (waste) or too late (breakdown) |
| Cone mantle | Every 6 months | Predictable | Ignores actual ore conditions |
| Blow bars | Every 2 months | Easy to plan | Seasonal ore changes not accounted for |
| VSI rotor tips | Every 400 hours | Based on hours, not calendar | Better than pure calendar |
Best for: Operations with very consistent feed material and production rates.
Approach 2: Production-based (better)
Schedule maintenance based on tonnes processed rather than calendar time:
| Component | Typical life (tonnes) | Schedule at |
|---|---|---|
| Jaw plates (Mn18Cr2, granite) | 50,000–100,000 | 80% of expected |
| Cone mantle (Mn18Cr2, granite) | 100,000–200,000 | 80% of expected |
| Blow bars (Cr26, gravel) | 30,000–60,000 | 80% of expected |
| VSI rotor tips (Cr26+WC, granite) | 20,000–40,000 | 80% of expected |
Best for: Operations with variable production rates but consistent ore type.
Approach 3: Condition-based (optimal)
Monitor actual wear condition and schedule replacement when a threshold is reached:
- Install wear indicators — some OEMs offer embedded wear indicators that signal at 50% wear
- Regular measurement — profile gauges at scheduled intervals (weekly for jaw, monthly for cone)
- Trend analysis — plot wear vs. time/tonnes, extrapolate to replacement threshold
- Trigger maintenance when predicted remaining life = safety margin (typically 2–4 weeks)
Best for: All operations — this is the gold standard. Requires measurement discipline but pays for itself in avoided waste and avoided breakdowns.
Approach 4: Predictive (advanced)
Use sensor data and analytics to predict wear:
- Vibration monitoring — increasing vibration indicates liner wear or loosening
- Power draw trending — increasing power per tonne indicates tightening CSS from liner wear
- Product gradation monitoring — shifting product size indicates worn liners
- Oil analysis — metallic particles in crusher lube oil indicate bushing/liner wear
Best for: Large operations with SCADA/DCS systems and data analytics capability.
Building the maintenance calendar
Step 1: List all wear components
For a typical crushing circuit (1 jaw + 1 cone + 1 impact):
| # | Component | Expected life | Lead time | Reorder point |
|---|---|---|---|---|
| 1 | Jaw plates (fixed + swing) | 3 months | 4 weeks | 6 weeks before expected end |
| 2 | Cone mantle | 6 months | 6 weeks | 8 weeks before |
| 3 | Cone concaves | 8 months | 6 weeks | 8 weeks before |
| 4 | Impact blow bars | 2 months | 3 weeks | 5 weeks before |
| 5 | Impact apron liners | 6 months | 4 weeks | 6 weeks before |
| 6 | Cheek plates | 6 months | 4 weeks | 6 weeks before |
| 7 | VSI rotor tips | 400 hours | 3 weeks | 300 hours |
| 8 | Eccentric bushing | 24 months | 8 weeks | 16 weeks before |
Step 2: Group into shutdown packages
Combine components that can be changed in the same shutdown to minimise total downtime:
| Shutdown | Components | Frequency | Duration | Crew size |
|---|---|---|---|---|
| Minor | Jaw plates, blow bars | Every 2–3 months | 4–6 hours | 4–6 |
| Major | Cone mantle + concaves, apron liners | Every 6–8 months | 12–16 hours | 6–8 |
| Annual | All above + eccentric bushing, structural inspection | Every 12 months | 24–36 hours | 8–10 |
Step 3: Coordinate with production
- Schedule major shutdowns during planned production gaps (seasonal slowdowns, market-driven curtailments)
- Stagger multiple crusher shutdowns so at least one crusher is always available
- Build in float time — schedule 1–2 weeks earlier than the predicted limit
Budget planning
Annual wear parts cost model
| Cost element | Calculation | Example (mid-size quarry) |
|---|---|---|
| Jaw plates | 4 changes × $15,000 | $60,000 |
| Cone liners | 2 sets × $40,000 | $80,000 |
| Impact blow bars | 6 changes × $10,000 | $60,000 |
| VSI rotor tips | 6 changes × $12,000 | $72,000 |
| Miscellaneous (cheek plates, bolts, etc.) | 15% of above | $40,000 |
| Subtotal parts | $312,000 | |
| Change-out labour | 12 shutdowns × $5,000 | $60,000 |
| Crane/rigging | 12 shutdowns × $2,000 | $24,000 |
| Backing compound, consumables | 5% of parts | $15,600 |
| Total annual wear cost | $411,600 | |
| Annual production | 2,000,000 tonnes | |
| Cost per tonne | $0.21 |
Budget reduction strategies
| Strategy | Potential saving | Implementation effort |
|---|---|---|
| Upgrade material grade (Mn18Cr2 → Cr26 where applicable) | 15–25% parts cost reduction | Low — just change the order spec |
| Switch to quality aftermarket | 40–50% parts cost reduction | Medium — supplier qualification |
| Condition-based scheduling | 10–15% reduction (less waste) | Medium — measurement discipline |
| Optimise CSS and feed preparation | 10–20% life extension | Low — operational adjustment |
| Hard-facing reconditioning | 30–50% on reconditionable parts | Medium — requires welding capability |
See our OEM vs aftermarket comparison and material comparison guides for detailed cost analysis.
KPI tracking
Monitor these metrics monthly to continuously improve:
| KPI | Formula | Target |
|---|---|---|
| Wear cost per tonne | Total wear cost ÷ tonnes produced | < $0.20/tonne (varies by application) |
| Liner utilisation | Actual life ÷ expected life | > 90% |
| Unplanned shutdown ratio | Unplanned hours ÷ total shutdown hours | < 10% |
| Parts inventory turns | Annual parts spend ÷ average inventory value | 4–6 turns/year |
| Mean time between failures (MTBF) | Operating hours ÷ number of failures | Maximise (track trend) |
FAQ
How much should I budget for crusher wear parts?
As a percentage of total crushing cost: 15–25% for hard rock (granite, basalt), 8–15% for moderate rock (limestone, dolomite). For a quarry producing 2M tonnes/year at $3/tonne crushing cost: budget $360,000–600,000 for hard rock, $240,000–450,000 for moderate.
Should I keep spare parts in inventory?
Yes, for critical single-point-of-failure components (mantle, concave set, main frame liner). The carrying cost (15–25% per year) is far less than the cost of an emergency shutdown. For high-consumption items (jaw plates, blow bars), order on a scheduled cycle rather than stocking.
How do I handle seasonal production variation?
Build your schedule on operating hours or tonnes, not calendar months. In high-production seasons, liners wear faster in calendar time but at the same rate per tonne. Adjust your measurement frequency — measure more often when production is high.
What if I can’t measure wear during operation?
For components that can’t be safely accessed during operation (e.g., cone concaves behind the adjustment ring), use proxy indicators: (a) product gradation shift (more fines = worn liners), (b) power draw increase, (c) throughput decrease at constant CSS. Calibrate these proxies against actual measurements taken during shutdowns.
How do I budget for a new crusher with no wear history?
Start with OEM recommendations for expected life, then: (a) apply a 20% conservative factor for your first budget, (b) benchmark against similar operations in your region, (c) track actual wear from day one and adjust after the first 2–3 change cycles.
Can I extend liner life by reducing throughput?
Technically yes — lower throughput means fewer tonnes of abrasive material passing through. However, the cost per tonne usually increases because fixed costs (labour, power, overhead) are spread over fewer tonnes. It’s almost always better to run at full rate and optimise material selection and maintenance scheduling instead.
Summary
Effective crusher maintenance scheduling combines condition-based monitoring (measure wear, predict replacement) with production coordination (schedule shutdowns to minimise impact). Budget planning should model total cost per tonne, not just parts price, and track KPIs monthly to drive continuous improvement. The difference between good and poor maintenance planning is typically 20–30% of total wear cost — hundreds of thousands per year for a mid-size operation.
Need help building your maintenance schedule? Contact our engineering team — we’ll analyse your operating data and provide a customised plan with predicted wear rates and budget estimates.